Tariffs and Trade Data Don’t Tell the Full Story
Analysis of the UK car industry by sub-sector
What Balance Sheets Reveal
UK companies are once again facing the threat of US import tariffs. While most analysis focuses on export volumes to America, our approach delves deeper. By examining real company accounts filed electronically over the past 12 months, we assess the financial strength of UK industries. This method reveals which sectors are equipped to withstand shocks and which are already vulnerable.
For professionals in business analysis, risk management, or investment, this balance sheet-based analysis offers a more nuanced understanding of sector resilience. It moves beyond surface-level trade data to uncover underlying financial health, providing valuable insights for strategic decision-making.
What Makes a Sector Resilient?
We focused on key balance sheet ratios:
Current ratio: Can firms cover their short-term bills? Current ratio measures a company's ability to meet its short-term obligations using its short-term assets. A ratio above 1 indicates the company has more current assets than liabilities, suggesting a stronger liquidity position. Low or negative current ratios are a warning sign that a business may face cashflow issues during periods of stress.
Debt to equity: How heavily are they borrowing compared to their capital? To put this into context, leverage (measured as the debt-to-equity ratio) is a critical indicator of risk. It tells us how much of a company’s operations are financed through debt rather than owner investment. A high leverage ratio often signals financial fragility, as firms are more exposed to interest costs and repayment pressures during downturns. Sectors with lower leverage typically have more flexibility to navigate disruption, making this one of the most important factors in our assessment.
Net asset growth: Are companies building strength or declining? Net asset growth compares a company’s current total net assets to the previous accounting year. Positive growth indicates financial strengthening, for example from reinvested profits or asset accumulation. Declining net assets can reflect losses, depreciation, or debt increases. Over time, this trend tells us whether firms are becoming more robust or more exposed.
This approach shows whether industries can absorb disruption, regardless of whether it comes from tariffs, inflation or a domestic slowdown.
The Car Industry: More Than Just Vehicle Sales
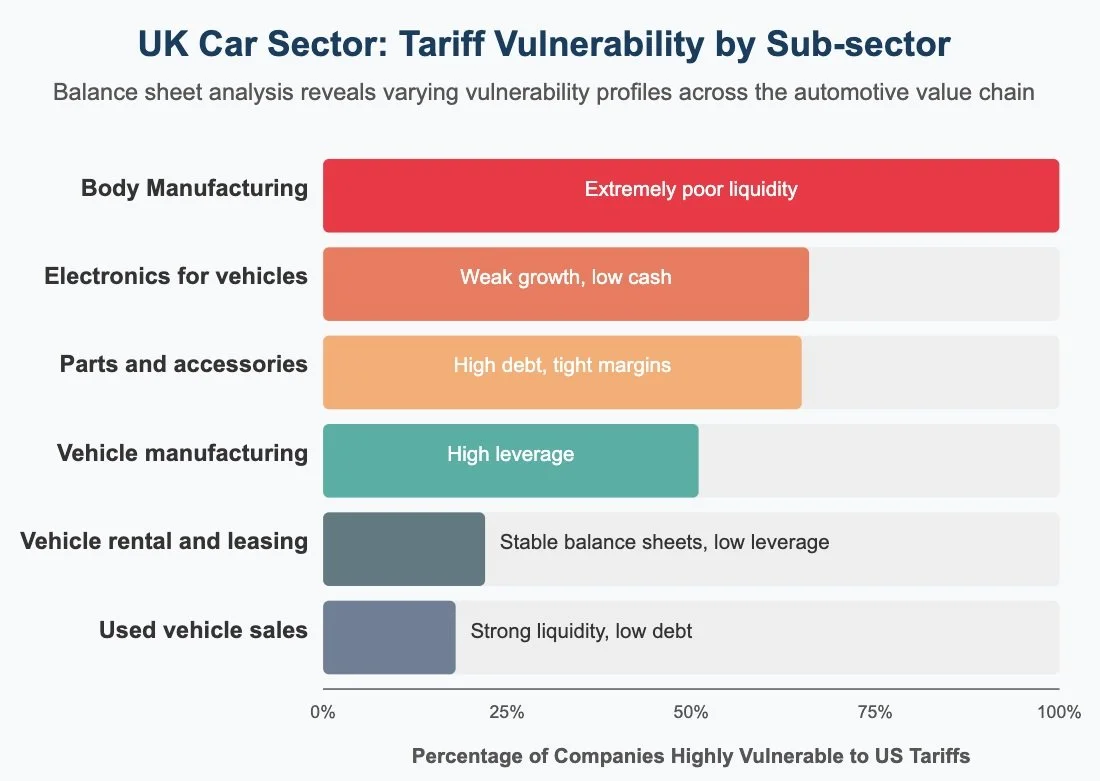
Much of the attention around tariffs focuses on car exports. But the car industry is made up of very different sub-sectors, each with its own financial profile:
| Car Sub-sector | Highly Vulnerable (%) | Key Balance Sheet Issue |
|---|---|---|
| Coachwork (body manufacturing) | 100% | Extremely poor liquidity |
| Parts and accessories | 65% | High debt, tight margins |
| Electronics for vehicles | 66% | Weak growth, low cash |
| Vehicle manufacturing | 51% | High leverage |
| Used vehicle sales | 18% | Strong liquidity, low debt |
| Vehicle rental | 22% | Stable balance sheets, low leverage |
| Vehicle leasing | 22% | Stable balance sheets, low leverage |
These figures are not based on trade export levels alone. They reflect balance sheet data reported by companies across each sub-sector and takes into account liquidity, debt-to-equity, and net asset trends. By analysing these key financial ratios on a sub-sector level, we’ve identified how each part of the car industry may react to disruption such as US tariffs.
This is vital because it shows that risk is not evenly distributed across what’s often presented as a single industry. Some companies are much more resilient than others and that distinction matters for analysts, investors, and policy-makers alike.
Strong Balance Sheets, Even With US Exposure
| Sector | Highly Vulnerable (%) | Key Financial Strength |
|---|---|---|
| Scottish whisky distillers | 20% | Strong liquidity |
| Paints and coatings | 25% | Balanced assets vs liabilities |
| Pharmaceuticals | 32% | Low debt-to-equity ratios |
To reach these figures, we analysed the latest balance sheets from each company and assessed their financial health based on ratio thresholds aligned with risk exposure. These industries export significantly to the US and are often flagged as being at risk from tariffs. However, our data shows that many firms in these sectors maintain robust balance sheets which makes them more likely to weather temporary shocks. This reinforces the importance of assessing internal financial resilience, not just external trade links.
Weak Balance Sheets at Home
| Sector | Highly Vulnerable (%) | Key Financial Weakness |
|---|---|---|
| Private education | 49% | Low current ratios, high borrowing |
| Construction | 27% | High leverage, low cash coverage |
| Care and social services | 35% | Thin reserves, heavy liability exposure |
This data highlights industries with weak financial fundamentals even though most have limited or no exposure to US trade. The takeaway? Trade disruption isn't the only threat to sector stability. Many sectors are already financially stretched and could struggle under any cost pressure or decline in income. For those working in investment, credit analysis or risk, understanding where vulnerabilities lie is essential, whether linked to tariffs or not.
What This Means
Export statistics alone do not explain which sectors are truly at risk. Our analysis shows that some export-heavy industries are well equipped to manage volatility, while others with little trade exposure are financially exposed.
Understanding financial fundamentals provides a clearer view of the economy. By analysing real balance sheets, we can:
Identify sectors most at risk from disruption
Understand where support may be needed
Provide better signals to investors and analysts
This approach is not based on projections or surveys. It reflects the actual financial state of thousands of UK companies filing electronic accounts. If you're looking to go beyond the headlines, balance sheet data offers the insight that trade figures alone cannot.
If you’re an analyst, investor, or business decision-maker, and want to understand which companies or sectors are truly at risk, we can help.
We provide access to curated balance sheet data, tailored risk insights, and custom reports for UK sectors based on real financial filings, not projections.
To explore the data or commission a sector-level analysis, get in touch at contact@dataledger.uk.